Top like tools you should know about
Any one who spends time at the command line has come across the top command (Unix) used for system administration. Top constantly displays useful information about the system is running on within the limits of the command line. If you like top then consider the following list of top like tools. To install any of the tools on your system check with your package manger or scroll to the bottom of this page.
atop
atop is an interactive system monitor, it can display information about disk I/O and network activity, memory, cpu, and swap use. 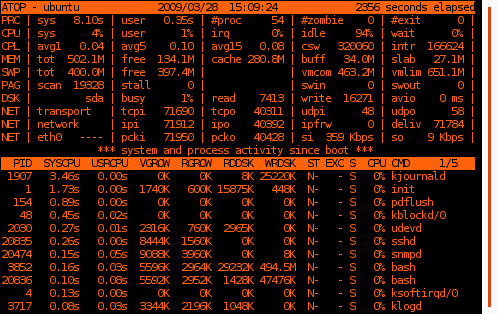
htop
htop is an advanced, interactive process viewer written for Linux. It is designed to replace the Unix program top. It shows a frequently updated list of the processes running on a computer, normally ordered by the amount of CPU usage. Unlike ‘top’, htop provides a full list of processes running, instead of the top resource consuming processes. htop also uses color and gives visual information about processor, swap and memory status. 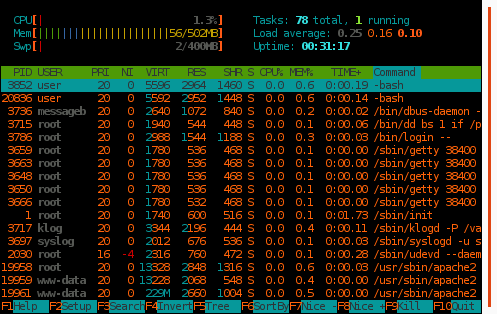
iftop
iftop does for network usage what top does for CPU usage. It listens to network traffic on a named interface and displays a table of current bandwidth usage by pairs of hosts. It displays the amount of traffic, hostnames sending and receiving data, useful for real time. Tip: press p to display the ports being used by the connections. 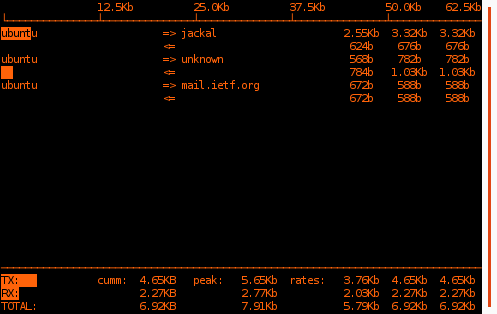
iotop
Linux has always been able to show how much I/O was going on (the bi and bo columns of the vmstat 1 command). Iotop is a Python program with a top like UI used to show of behalf of which process is the I/O going on. 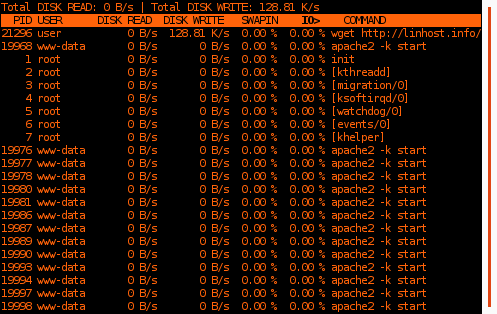
mytop
mytop is a console-based (non-gui) tool for monitoring the threads and overall performance of a MySQL 3.22.x, 3.23.x, and 4.x server. It runs on most Unix systems (including Mac OS X) which have Perl, DBI, and Term::ReadKey installed. You’ll get good real-time queries/second stats. 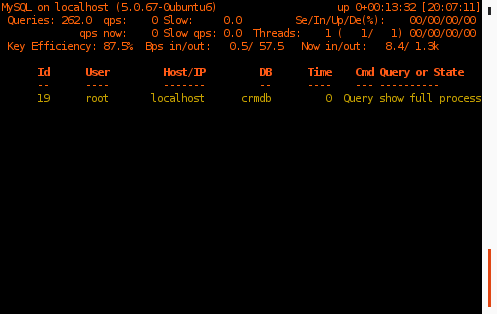
mtop
mtop (MySQL top) monitors a MySQL server showing the queries which are taking the most amount of time to complete. Features include ‘zooming’ in on a process to show the complete query, ‘explaining’ the query optimizer information for a query and ‘killing’ queries. Note: use mytop instead 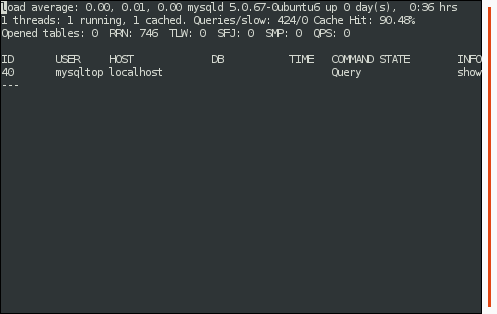
apachetop
apachetop is a curses-based top-like display for Apache information, including requests per second, bytes per second, most popular URLs. apachetop watches logfiles generated by Apache. Accepting suggestions.
References
- http://guichaz.free.fr/iotop/
- http://www.webta.org/projects/apachetop/
- http://mtop.sourceforge.net/
- http://htop.sourceforge.net/
- http://www.ex-parrot.com/~pdw/iftop/
- http://www.atcomputing.nl/Tools/atop/
- http://jeremy.zawodny.com/mysql/mytop/
apachetop, atop, htop, iftop, iotop, mtop, mytop — Apr 1, 2009